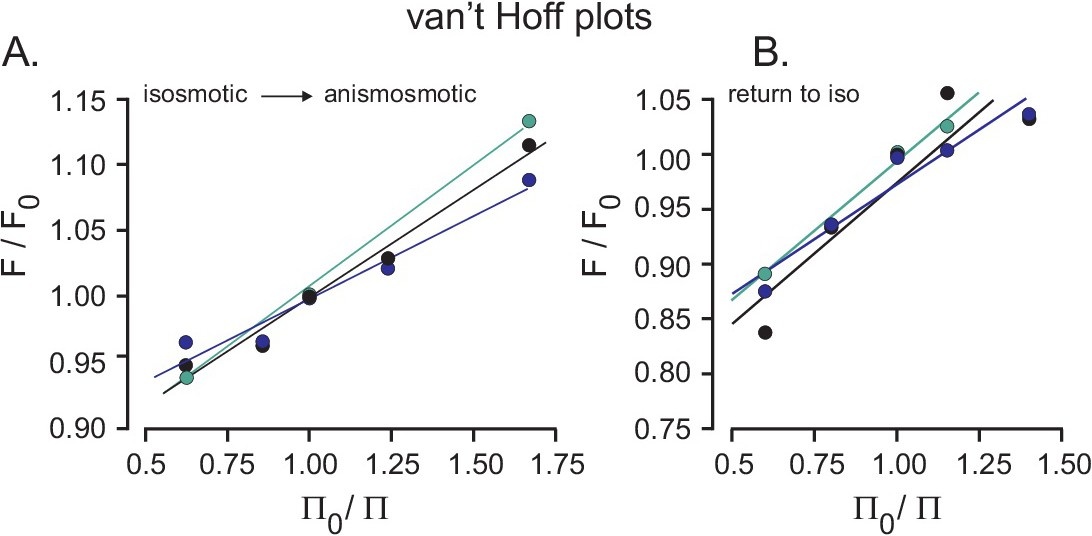
Fig. 7. Osmotic sensitivity of neurons. Van't Hoff plot showing fluorescence ratio versus osmotic pressure ratio of neurons exposed to 40% and 15% hypotonic and hypertonic shock. Note that the slope of the KCC3 gain-of-function neurons (blue dots and line, y = 0.126 x ± 0.8715) is lower than the slope of wild-type neurons (black dots and line, y = 0.1651 x ± 0.8330); whereas the slope of the KCC3 knockout neurons (green dots and line, y = 0.1861 x ± 0.8211) is bigger that for wild-type neurons. (B) van't Hoff plot of neurons returning to isosmotic conditions. There was no significant difference among the slopes (P = 0.7) nor intercepts (P = 0.6). All slopes appear similar (control, y = 0.2563 x ± 0.7187; GOF y = 0.1984 ± 0.7742; LOF y= 0.2515 x ± 0.7419).